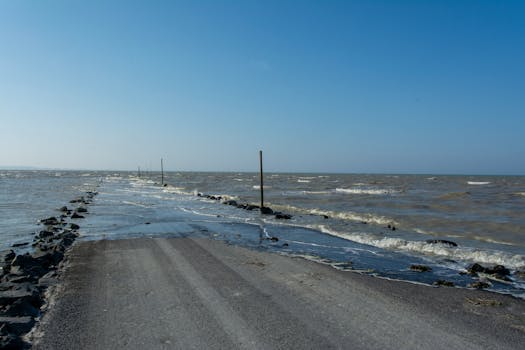
Climate change brings alarming consequences, including rising sea levels. A new interactive tool, Sea Level Rise 3D Map, uses Google Maps to show how rising sea levels could impact your home and coastal areas. Visualize the potential effects of climate change with this powerful simulator.
Visualize Rising Seas: Will Your Home Be Affected?
Climate change presents many challenges, and rising sea levels are among the most concerning. While it might seem like a distant threat, the effects are already being felt worldwide. Scientific projections urge us to prepare for a future where coastlines could drastically change. An innovative tool has emerged to bring this issue closer to home: a Google Maps-based simulator that lets you check if rising sea levels will impact your property.
Introducing Sea Level Rise 3D Map
This project, created by developer Akihiko Kusanagi, is called "Sea Level Rise 3D Map." It's an interactive simulation that uses realistic 3D imagery from Google Maps, combined with rendering technologies like deck.gl and three.js. The result is a 3D map that offers a realistic and dynamic visualization of how the planet's coastal geography might change with rising sea levels.
Unlike traditional 2D maps, this tool offers an immersive and somewhat unsettling experience, allowing anyone to see the potential consequences of climate change firsthand. Furthermore, its code is completely open-source and available on GitHub, enabling community use and improvement.
How Does It Work?
The Sea Level Rise 3D Map interface is simple and effective. Users can adjust two key parameters:
- Sea Level: The most important control allows you to gradually increase the water level, meter by meter. With each increment, a blue layer covers the terrain, starting from port areas and beaches and extending into urban areas. Remember that for every centimeter the sea level rises, the coastline can retreat by a meter.
- Time: Another control adjusts the lighting and shadows of the environment, adding realism and depth to the simulation.
A standout feature is the built-in search engine, which allows you to navigate to any point on the globe with 3D coverage on Google Maps. From the Statue of Liberty in New York to the Sagrada Familia in Barcelona and Big Ben in London, you can see how they might look underwater under different sea-level rise scenarios.
Understanding the Science Behind the Simulation
It's important to remember that this simulation is based on real scientific data and projections. The Intergovernmental Panel on Climate Change (IPCC) has stated that even if global warming is limited to 1.5°C, sea levels will inevitably continue to rise. Estimates for sea-level rise by 2100 range from 43 cm in the best-case scenario to over 84 cm in the worst.
The Importance of Visualization
Projects like this are essential for understanding the magnitude of the climate challenge. With just a few clicks, users can visualize what scientists already know: that rising sea levels, even by a few meters, can have devastating consequences.
Beyond the technical impact, this map offers a stark reflection: what seems like a simulation today could become a reality tomorrow.
Practical Examples: Exploring the Impact
Let's look at some practical examples of how you can use this tool:
- Check Your Own Home: The most obvious use is to enter your address (or the address of a property you're interested in) and see how it might be affected by different levels of sea rise. This can be particularly impactful for coastal residents.
- Explore Vulnerable Cities: Try exploring cities like Miami, Venice, or Amsterdam, which are known to be particularly vulnerable to rising sea levels. The simulation can vividly illustrate the potential flooding in these areas.
- Understand Regional Differences: Sea-level rise doesn't affect all areas equally. Explore different regions to see how the impact varies depending on local geography and elevation.
Tips for Using the Simulator
- Start Small: Begin by increasing the sea level in small increments to see how the water gradually encroaches on the land.
- Use the Search Function: Take advantage of the search function to quickly navigate to different locations of interest.
- Experiment with Lighting: Adjust the "time" control to see how different lighting conditions affect the visualization.
- Share Your Findings: Share screenshots or videos of your explorations with others to raise awareness about the issue.
Conclusion: A Call to Action
The Sea Level Rise 3D Map is more than just a cool visualization tool. It's a powerful reminder of the real and present threat of climate change. By allowing us to visualize the potential impact of rising sea levels, it can help us to better understand the urgency of the situation and to take action to mitigate the effects of climate change.
This interactive map serves as a powerful reminder of the potential consequences of inaction. It underscores the importance of reducing carbon emissions and pursuing sustainable practices to protect our coastal communities and the planet as a whole. Explore the map, share your findings, and let's work together to create a more sustainable future. [Sea Level Rise 3D Map](https://nagix.github.io/sea-level-rise-3d-map/#/2.192356581913566/41.389378794365925/15.01100950640312/-81.52/60)
